|
Getting your Trinity Audio player ready...
|
If you are writing a business plan, the financial section is likely the part you are dreading most. In my 15 years as a financial consultant helping U.S. startups secure funding, I have seen brilliant entrepreneurs freeze up when asked to translate their vision into spreadsheets. But here is the truth: lenders and investors don’t expect you to be a CPA. They just want to see that you understand how your business makes money.
A solid example of financial forecast in business plan documents isn’t just about guessing the future; it is about proving your business model is viable.
Whether you are applying for an SBA 7(a) loan or pitching a specialized VC firm, your numbers tell the story of your survival and growth. Below, I will break down exactly how to build this, complete with a realistic, concrete example you can model yours after.
Why Your Forecast Matters More Than Your Idea
Most entrepreneurs think the “Executive Summary” or the “Product Description” is the heart of the plan. It isn’t. The heart is the financials.
When an angel investor looks at a startup financial forecast example, they are looking for “logic,” not “magic.” They want to see the link between your marketing spend and your revenue. They want to know if you have budgeted enough cash to survive the first 18 months (the “Valley of Death”).
If your business plan financial projections show you making $10 million in Year 1 with zero marketing budget, your plan goes in the trash. The forecast validates the rest of the document.
The Core Components of a Financial Plan
- Income Statement (P&L): Profit and Loss. Revenue minus expenses.
- Cash Flow Statement: The movement of actual cash (crucial for survival).
- Balance Sheet: Assets vs. Liabilities.
For the purpose of this guide, we will focus on the Income Statement, as this is the “storyteller” of the group.
Real-World Example of Financial Forecast in Business Plan
To make this useful, let’s look at a concrete example of financial forecast in business plan writing using a fictional but realistic U.S. small business.
The Scenario: “Metro Coffee Roasters”
- Business Type: Specialty coffee shop and roastery in Austin, Texas.
- Stage: Pre-revenue Startup.
- Funding Goal: Seeking $250,000 SBA loan for build-out and equipment.
Step 1: Revenue Assumptions (The Drivers)
Never just write “Revenue: $500,000.” You must break it down by unit drivers. This is a classic revenue forecast example that investors love because they can check your math.
Metro Coffee Assumptions:
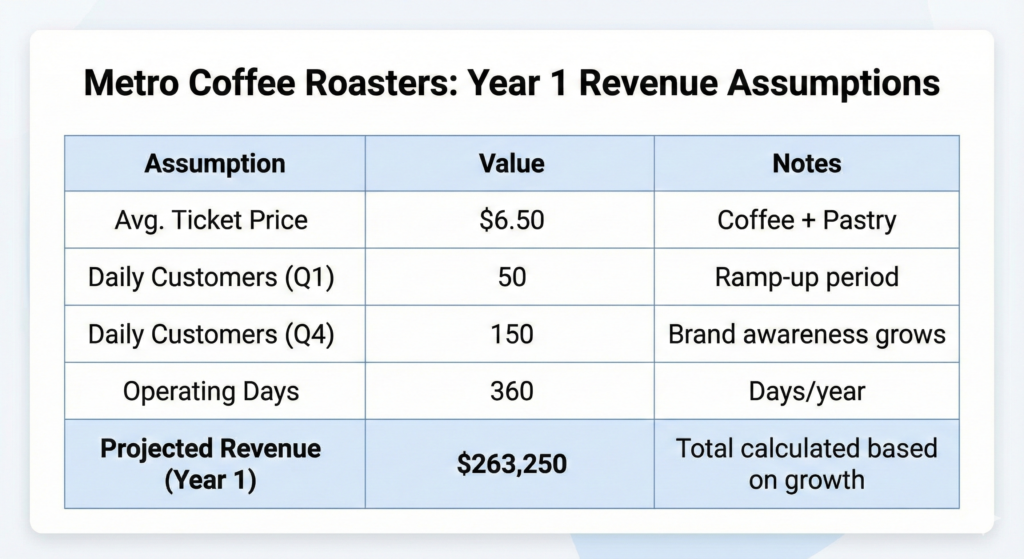
- Avg Ticket Price: $6.50 (Coffee + Pastry).
- Daily Customers (Year 1): Starts at 50/day, grows to 150/day by end of year as brand awareness grows.
- Operating Days: 360 days/year.
Projected Revenue Year 1:
- Q1 (Ramp-up): 60 customers/day x $6.50 x 90 days = **$35,100**
- Q2: 100 customers/day x $6.50 x 90 days = **$58,500**
- Q3: 130 customers/day x $6.50 x 90 days = **$76,050**
- Q4 (Peak): 160 customers/day x $6.50 x 90 days = **$93,600**
- Total Year 1 Revenue: $263,250
Note: See how the growth is gradual? That is realistic.
Step 2: Expense Budgeting
Expenses fall into two buckets: COGS (Cost of Goods Sold) and OpEx (Operating Expenses).
- COGS: For a coffee shop, this is beans, milk, cups, and lids. Industry standard is roughly 25-30%. Let’s use 30%.
- OpEx: Rent, utilities, insurance, marketing, and payroll.
Metro Coffee Fixed Monthly OpEx:
- Rent: $3,500
- Utilities/Internet: $600
- Staff Wages (2 Baristas): $5,000
- Marketing (Local SEO/Social): $1,000
- Insurance/Legal: $400
- Total Monthly Fixed Costs: **$10,500** ($126,000/year)
Step 3: The Projected P&L Statement
Now we combine them into the full financial forecast business plan example.
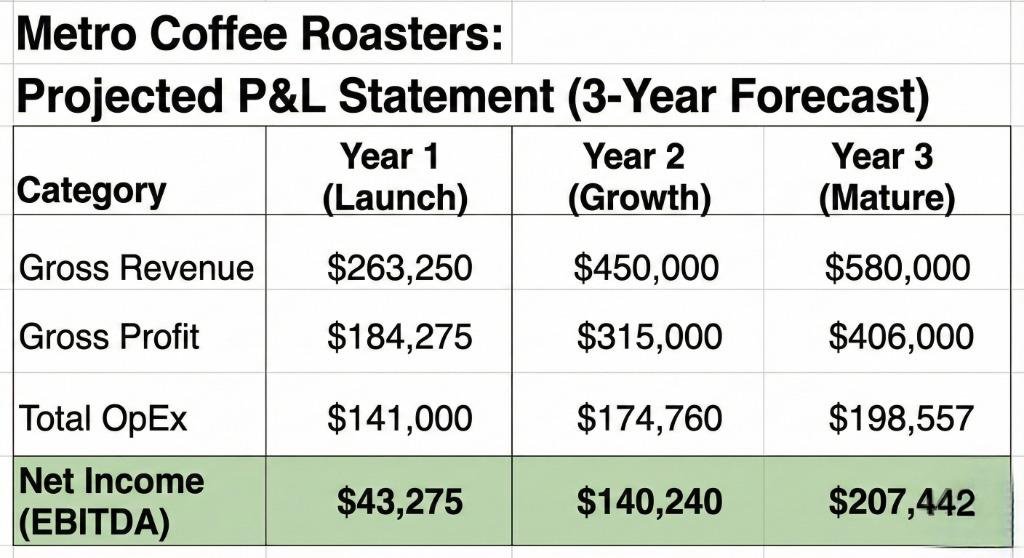
Analysis of the Numbers:
In Year 1, the business is profitable but tight. By Year 3, efficiencies kick in. This represents a healthy, investable service business. If you are a SaaS or tech company, your margins might look different (higher gross margin, higher marketing spend), but the structure remains the same.
My Experience: The “Hockey Stick” Lie and Other Mistakes
In my career reviewing hundreds of pitch decks, I have developed a keen eye for “fake” numbers. Here is a personal look at what goes wrong when entrepreneurs build their own financial projections for business plan documentation.
The “Hockey Stick” Curve
Everyone wants to look like the next Uber. I often see charts that are flat for six months and then shoot up vertically to millions in revenue. I call this the “Hockey Stick” lie. Unless you have a signed contract with a massive distributor, revenue rarely explodes like that. Growth is usually a staircase—step by step.
My Advice: Build a conservative case and an aggressive case. Present the conservative one to the bank. It builds trust.
Forgetting the “Cash Gap”
I once worked with a client launching a product line. His P&L showed massive profits in Month 2. But he didn’t account for the fact that retailers pay on “Net 60” terms. He sold the goods in January but didn’t get the cash until March. He almost went bankrupt in February despite being “profitable” on paper.
My Advice: Always create a Cash Flow Statement alongside your P&L. Profit is a theory; cash is a fact.
Seasonality Blindness
I reviewed a plan for a landscaping business in Chicago that projected equal revenue in January and July. That is a red flag that tells me you don’t understand your own industry.
My Advice: Adjust your example of financial forecast in business plan templates to reflect the reality of the calendar. If you are in retail, spike Q4. If you are in tourism, spike summer.
Final Thoughts
Creating a financial forecast isn’t about having a crystal ball. It is about mapping out a path.
When you present a robust example of financial forecast in business plan meetings, you are telling the investor: “I have thought through the risks. I know what my costs are. I have a plan to pay you back.”
Start with your assumptions. Count the customers, not just the dollars. Keep your expenses realistic. If you do that, your financial section will be the strongest part of your plan, not the scariest.
Next Steps for You
If you are currently building your forecast, stop looking at the blank spreadsheet. Start by listing your assumptions (Price per unit, units sold per day, cost per employee). Once you have those variables, the math does itself.
Pingback: Best IT Financial Management Tools (2026 Reviews)